
I got a "let me google it for you" page.That takes me to some kind of image search page with the words in the search bar. Goes nowhere after that.
You are using an out of date browser. It may not display this or other websites correctly.
You should upgrade or use an alternative browser.
You should upgrade or use an alternative browser.
Biden Supreme Court Nominee Ketanji Brown Jackson
- Thread starter Gameface
- Start date
Red
Well-Known Member
It will be interesting, and sad, to see the attempts at slander and libel that will inevitably be used to discredit her.

Jackson’s full dissent:

Read Ketanji Brown Jackson’s Full Dissent After SCOTUS Ends Affirmative Action
Justice Ketanji Brown Jackson gives a unique perspective on the Supreme Court's decision to end Affirmative Action.
 newsone.com
Same piece, no paywall…
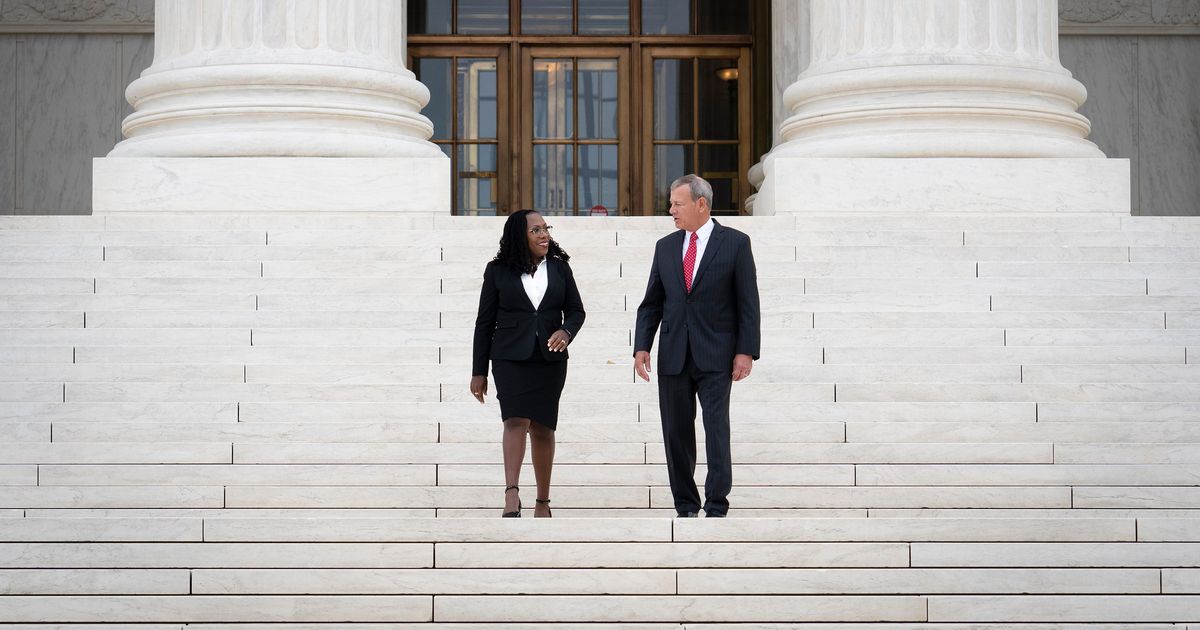
In her first term, Justice Ketanji Brown Jackson 'came to play'
From her first week on the Supreme Court bench in October to the final day of the term that ended last week, Justice Ketanji Brown Jackson did something remarkable for a junior justice: She established herself as a distinctive voice on the court.
Last edited:
At last, you stated accurately the main point. Thank you.Where it all goes off the rails is when racists make the evidence-free leap to claiming these disparate outcomes from doctors of unknown ethnicity is proof that Blacks being best served by sticking to their own kind is a scientific fact, or the bias inherent with European skin colors is causing those doctors to kill Black babies. It is when those claims are made that I want to see your homework and that is a thing not addressed at all in your linked article.
The study that (I believe) Jackson referred to, inelegantly:
Findings suggest that when Black newborns are cared for by Black physicians, the mortality penalty they suffer, as compared with White infants, is halved. Strikingly, these effects appear to manifest more strongly in more complicated cases, and when hospitals deliver more Black newborns. No such concordance effect is found among birthing mothers.

Race, Gender, and Partnership in the Patient-Physician Relationship
Context Many studies have documented race and gender differences in health care received by patients. However, few studies have related differences in the quality of interpersonal care to patient and physician race and gender.Objective To describe how the race/ethnicity and gender of patients and...
 jamanetwork.com
Patients in race-concordant relationships with their physicians rated their visits as significantly more participatory than patients in race-discordant relationships (difference [SE], 2.6 [1.1]; P=.02). ... Our data suggest that African American patients rate their visits with physicians as less participatory than whites. However, patients seeing physicians of their own race rate their physicians' decision-making styles as more participatory. Improving cross-cultural communication between primary care physicians and patients and providing patients with access to a diverse group of physicians may lead to more patient involvement in care, higher levels of patient satisfaction, and better health outcomes.
I have access to this link through the medical school
What stand out more distinctly are the strong correlations between physician race/ethnicity and practice patterns (Fig. 2). Black physicians are 59% points more likely to check blood pressure and 27% points more likely to ask about tobacco use than whites. These imply rates about 80% and 39% higher than white physicians' mean screening rates of 74% and 69%, respectively. Hispanic physicians are 20% points more likely to check men's cholesterol than white physicians (1.5 times whites' average rate of 13%), but less likely to check women's cholesterol. Asian physicians are 48% points less likely than whites to check blood pressure (65%) and 37% points less likely to check women's cholesterol (whites' mean rate is 10%), whereas they are 60% points more likely to ask about tobacco use.
The Effects of Race and Racial Concordance on Patient-Physician Communication: A Systematic Review of the Literature - Journal of Racial and Ethnic Health Disparities
Objective Racial disparities exist in health care, even when controlling for relevant sociodemographic variables. Recent data suggest disparities in patient-physician communication may also contribute to racial disparities in health care. This study aimed to systematically review studies...
 link.springer.com
Racial concordance was more clearly associated with better communication across all domains except quality, for which there was no effect.
Race-concordant visits were longer (2.15 minutes [95% CI, 0.60 to 3.71]) and had higher ratings of patient positive affect (0.55 point, [95% CI, 0.04 to 1.05]) compared with race-discordant visits. Patients in race-concordant visits were more satisfied and rated their physicians as more participatory (8.42 points [95% CI, 3.23 to 13.60]). Audiotape measures of patient-centered communication behaviors did not explain differences in participatory decision making or satisfaction between race-concordant and race-discordant visits.
Any analysis of the level of achievement needs to account for the circumstances surrounding the achiever, the race of the achiever impacts that environment in significant ways. We already have affirmative action in medical schools for legacies, children of donors, etc., and it has not noticeably reduced the level of medical care provided; they still have to get through the same medical school curriculum.Clearly it does not benefit the product to screen out higher achieving candidates to make room for lower achieving ones.
Where is your evidence for this?There is a cost, and that cost to society is collectively worse healthcare in the immediate term.
I have no expectation of it.A lot of people who have posted in this thread should be looking in the mirror and asking some uncomfortable questions about themselves, but I know they won’t.
Red
Well-Known Member
“Patients in race-concordant relationships with their physicians rated their visits as significantly more participatory than patients in race-discordant relationships (difference [SE], 2.6 [1.1]; P=.02). ... Our data suggest that African American patients rate their visits with physicians as less participatory than whites. However, patients seeing physicians of their own race rate their physicians' decision-making styles as more participatory.”
———————————————————————————————————————-
Funny, being white how can I possibly understand how a black patient feels talking with a black physician, and how he or she feels talking with a white physician? How can I understand it, from the perspective of a skin color I do not share? Yet, despite the barriers, it’s easy for me to simply believe that black patient, sitting in that final little waiting room, will be more relaxed and comfortable, for talking, when seeing a black physician enter that room. Not because I can really know, from the perspective of race, but based rather on my experience and interpretation of race relations in the United States. I make that assumption. I’m assuming the race of the patient is a factor that may increase his comfort level, his openness, if the doctor is the same race. It’s at a level where common sense would suggest that would be the case. Common sense based off the history and tone of race relations in my lifetime. There are always exceptions. Not applying this to policy, simply to what we’d expect from human nature.
My own experience. Mostly white physicians. Just judge by results I guess, changed primaries when the first one made matters worse. I’ve seen several Indian doctors. Come to expect thoroughness, high intelligence. Always very comfortable in their hands. Same with Asian. I can’t recall if, or when, I’ve ever been treated by a black physician.
Last edited:
Al-O-Meter
Well-Known Member
There is some really funky stuff going on in that data. The researchers are screening out tons of data. They only included 46.85% of Black babies, and only included 52.67% of White babies. That in and of itself isn't a deal breaker but when researchers give themselves that kind of wiggle room to play with who is included and who is screened out of the sample, it makes me nervous.
The statistic that jumps off the page is the number of comorbidities which is buried in Table S1a of the supporting material you have to download separately. If those statistics are representative of Florida's healthcare system, then Florida hospitals give their most challenging cases to racially disparate physicians. That is to say that when a Florida hospital has a higher risk Black baby they assign the work to a White physician, and when a Florida hospital has a higher risk White baby they assign the work to a Black physician. Because babies with a higher number of comorbidities have a higher mortality rate, such a practice would naturally create a statistical difference between babies with a racially concordant patient–physician relationship versus those who did not.
Furthermore, this disparity in cormorbidities explains the entire observed disparity in outcomes.
In Florida, per this research, when a Black doctor is assigned to a Black baby, that baby has a mean comorbidity count of 1.648
In Florida, per this research, when a Black doctor is assigned to a White baby, that baby has a mean comorbidity count of 1.845
That is a difference in mean comorbidies for Black doctors of 0.197
In Florida, per this research, when a White doctor is assigned to a Black baby, that baby has a mean comorbidity count of 1.775
In Florida, per this research, when a White doctor is assigned to a White baby, that baby has a mean comorbidity count of 1.469
That is a difference in mean comorbidies for White doctors of 0.306
Even if there were zero skill difference and zero racial biases, given this sample you would expect to see racially concordant patient–physician interactions have better clinical care outcomes, and for White doctors working with Black babies to have statistically worse outcomes as compared to Black doctors.
It could be that Florida really does assign at-risk deliveries in this manner, but the more likely explanation given the way the sample has been tailored, what is being reflected is a selection bias in the research. The researchers knew what they wanted to find and created a sample that would give the result they wanted.
Last edited:
There is some really funky stuff going on in that data. The researchers are screening out tons of data. They only included 46.85% of Black babies, and only included 52.67% of White babies. That in and of itself isn't a deal breaker but when researchers give themselves that kind of wiggle room to play with who is included and who is screened out of the sample, it makes me nervous.
file:///C:/Users/instructor/Downloads/pnas.1913405117.sapp.pdf
1,353,078 + 459,901 = 1,812,979. Since you saw Table S1a, you had access to this information.The initial dataset is comprised of 4,625,898 newborns. This pool is comprised of 2,568,942white newborns, 981,641 black newborns, 65,889 Asian newborns, and 928,849 Hispanic newborns. Theremaining 80,577 newborns are of other races (e.g. native American, Pacific Islander, et.). As discussed,newborns not classified as either white or black are omitted from the sample. Further, not all newbornsare treated by either a white or black physician (some physicians being of Asian, Latino, middle eastern,etc. descent). Of the 8,045 physicians in the sample with identified race, 3,936 of them are white, 514 areblack, 1,638 are Latino, and so on. The remaining sample is comprised of 1,353,078 white newborns, and459,901 black newborns. The panel is not extended prior to 1992 because information on patient race isnot available. The panel concludes in the third quarter of 2015 because the AHCA switches from coding procedures and diagnoses in ICD-9 to ICD-10. This allows coding to remain consistent
The number of observations listed in Table 1: 1,812,979.
The number of observations listed in Table 2: 547,394 + 1,265,576 = 1,812,970
The number of observations listed in Table 3: 1,435,490 1,435,469 + 377,481 = 1,812,970
Table S1a measures the existence of one or more comorbidities, and the standard deviations are basically the same size as the means. This data is too noisy to draw such a conclusion.The statistic that jumps off the page is the number of comorbidities which is buried in Table S1a of the supporting material you have to download separately. If those statistics are representative of Florida's healthcare system, then Florida hospitals give their most challenging cases to racially disparate physicians.
The difference in the mean count of comorbidities does not support your hypothesis. The differences are halved in Table 2, which breaks out the data according to the comorbidity status you suggest, but even then we much better outcomes for racially concordant pairings to a high degree of statistical significance.Even if there were zero skill difference and zero racial biases, given this sample you would expect to see racially concordant patient–physician interactions have better clinical care outcomes, and for White doctors working with Black babies to have statistically worse outcomes as compared to Black doctors.
Please go into the paragraph about the selection process and identify the bias.It could be that Florida really does assign at-risk deliveries in this manner, but the more likely explanation given the way the sample has been tailored, what is being reflected is a selection bias in the research. The researchers knew what they wanted to find and created a sample that would give the result they wanted.
Al-O-Meter
Well-Known Member
You're an idiot. First, the link you provided was a link to the file on your hard drive. We don't have access to your downloads folder in your instructor user profile on your C: drive.file:///C:/Users/instructor/Downloads/pnas.1913405117.sapp.pdf
1,353,078 + 459,901 = 1,812,979. Since you saw Table S1a, you had access to this information.
The number of observations listed in Table 1: 1,812,979.
The number of observations listed in Table 2: 547,394 + 1,265,576 = 1,812,970
The number of observations listed in Table 3: 1,435,490 1,435,469 + 377,481 = 1,812,970
Table S1a measures the existence of one or more comorbidities, and the standard deviations are basically the same size as the means. This data is too noisy to draw such a conclusion.
The difference in the mean count of comorbidities does not support your hypothesis. The differences are halved in Table 2, which breaks out the data according to the comorbidity status you suggest, but even then we much better outcomes for racially concordant pairings to a high degree of statistical significance.
Please go into the paragraph about the selection process and identify the bias.
Second, yes the number of observations in their proprietary subset was of 1,812,979 babies of Black and White ethnicity, but the post-1992 Florida dataset their proprietary dataset was drawn from contained 3,550,583 babies of Black and White ethnicity. There were 2,568,942 White babies but they only used 1,353,078, or 52.67% of them. There were 981,641 Black babies but the researchers only used 459,901, or 46.85% of them. All of that is listed very clearly in table S1a. Maybe look at the last 3 column sets of Table S1a that contain "Black Patient Omitted", "White Patient Omitted", and "Other Patients Omitted".
Lastly, it doesn't matter how they chopped up their proprietary subset after what appears to be a highly suspect inclusion/omission process. Once your tailor the dataset as they admit to doing, you can prove anything and I've already outlined why their proprietary dataset is suspect.
Sorry about that.You're an idiot. First, the link you provided was a link to the file on your hard drive. We don't have access to your downloads folder in your instructor user profile on your C: drive.
PNAS
Proceedings of the National Academy of Sciences (PNAS), a peer reviewed journal of the National Academy of Sciences (NAS) - an authoritative source of high-impact, original research that broadly spans the biological, physical, and social sciences.
www.pnas.org
I did, and it was explained in the paragraph that you seemed to have skipped over, again, even when I directly quoted it. They restricted the list to physicians whose race was determinable as white or black based on photographs.Second, yes the number of observations in their proprietary subset was of 1,812,979 babies of Black and White ethnicity, but the post-1992 Florida dataset their proprietary dataset was drawn from contained 3,550,583 babies of Black and White ethnicity. There were 2,568,942 White babies but they only used 1,353,078, or 52.67% of them. There were 981,641 Black babies but the researchers only used 459,901, or 46.85% of them. All of that is listed very clearly in table S1a. Maybe look at the last 3 column sets of Table S1a that contain "Black Patient Omitted", "White Patient Omitted", and "Other Patients Omitted".
They did not "chop it up", they set a standard and executed that standard. You're grasping at straws trying to deny the results of the study because it does not fit your view of the world, when the real problem is that the world does not fit your view of the world (nor mine, but I understand my model is inaccurate).Lastly, it doesn't matter how they chopped up their proprietary subset
Describe the reasons for your suspicions.after what appears to be a highly suspect inclusion/omission process.
Now, you're lying about the contents of the study and supplemental material.Once your tailor the dataset as they admit to doing, ...
Try again, this time analyzing their methodology as explained by them.... I've already outlined why their proprietary dataset is suspect.
Al-O-Meter
Well-Known Member
Their methodology allows for bias to be introduced via the physician image acquisition process. A researcher could have used the entire Florida dataset and assigned a priority weight to each doctor depending on how their inclusion swayed the end result. Doctors who pushed the result in the wrong direction could be omitted entirely from the image search list and as a result would also have their work omitted from the tailored dataset for lack of a photo to identify their ethnicity. Doctors who were net neutral could have a time limit of 5 minutes per search or given to a student of lesser diligence. Doctors of high priority could be searched for as long as it took to make sure they were not omitted. I do not know that is what they did but such a scheme fits entirely within the four corners of the researchers published methodology for tailoring this dataset down from the original Florida dataset. Even with a best case interpretation they did not control for bias in this process.Try again, this time analyzing their methodology as explained by them.
Beyond the sloppy methodology that lends itself to deliberate manipulation, this dataset reeks of sampling bias for the reason I've already hit on where high comorbidity cases are significantly overrepresented in the racially discordant physician-patient cohort.
Finally, and most importantly, if you are looking for a signal to prove ethnic bias in mortality rate then you absolutely must control for comorbidities in patients, and this paper doesn’t do that. When you control for comorbidities even in this suspect dataset, the physician racial bias vanishes. The conclusion of this paper should have been that infants with an elevated comorbidity rate have an elevated mortality rate, which could be filed under ‘duh’.
This paper is racist propaganda.
Last edited:
Since there's no way to know if a doctor could push the study in a particular direction without looking at their picture first, you're describing researcher fraud on the highest level.Their methodology allows for bias to be introduced via the physician image acquisition process. A researcher could have used the entire Florida dataset and assigned a priority weight to each doctor depending on how their inclusion swayed the end result. Doctors who pushed the result in the wrong direction could be omitted entirely from the image search list and as a result would also have their work omitted from the tailored dataset for lack of a photo to identify their ethnicity. Doctors who were net neutral could have a time limit of 5 minutes per search or given to a student of lesser diligence. Doctors of high priority could be searched for as long as it took to make sure they were not omitted. I do not know that is what they did but such a scheme fits entirely within the four corners of the researchers published methodology for tailoring this dataset down from the original Florida dataset. Even with a best case interpretation they did not control for bias in this process.
That is why Table 2 breaks down the effects of children with comorbidities and children without.Beyond the sloppy methodology that lends itself to deliberate manipulation, this dataset reeks of sampling bias for the reason I've already hit on where high comorbidity cases are significantly overrepresented in the racially discordant physician-patient cohort.
Actually, it is present to a degree of p < 0.01, according to Table 2.Finally, and most importantly, if you are looking for a signal to prove ethnic bias in mortality rate then you absolutely must control for comorbidities in patients, and this paper doesn’t do that. When you control for comorbidities even in this suspect dataset, the physician racial bias vanishes.
I'm sure you need it to be.This paper is racist propaganda.
Al-O-Meter
Well-Known Member
Yup. That is how this dataset looks. A dataset curated in the manner I described explains both of the final two sentences in the abstract which otherwise seem to be contradictions.Since there's no way to know if a doctor could push the study in a particular direction without looking at their picture first, you're describing researcher fraud on the highest level.
The ethnicity of a physician is the ethnicity of a physician, and the ethnicity of a patient is the ethnicity of a patient. The venue does not have any affect at all on ethnicity, but the venue does affect the mortality rate in their study. That doesn't make any sense if the issue is an ethnicity mismatch between doctor and patient.Results further suggest that these benefits manifest during more challenging births and in hospitals that deliver more Black babies.
If the researchers were honest, they had a strong case for proof of institutional racism where hospitals that deliver more Black babies are less effective at ameliorating comorbidities and as such comorbidities have a greater effect on infant mortality rate compared to hospitals delivering fewer Black babies.
This too is consistent with a manipulated dataset because the dataset wasn't manipulated for maternal comorbidites and so the racist signal in the data vanishes when looking at maternal mortality.We find no significant improvement in maternal mortality when birthing mothers share race with their physician.
Either traditionally Black hospitals are the most racist but the racists are only racist against babies, and Florida has an unwritten policy of having the most difficult cases handled by doctors of ethnicity not matching the patient, or this dataset has been massaged a bit.
You say "the issue", as if there is just one. Is the existence of more than one issue too discordant of your worldview?That doesn't make any sense if the issue is an ethnicity mismatch between doctor and patient.
In a study designed to detect the effects of racial concordance, one doesn't just switch in the middle to make the study about venue principally. Funds have been allocated to study a specific effect, the IRB has approved specific parameters, etc.
Both are likely true.If the researchers were honest, they had a strong case for proof of institutional racism where hospitals that deliver more Black babies are less effective at ameliorating comorbidities and as such comorbidities have a greater effect on infant mortality rate compared to hospitals delivering fewer Black babies.
This too is consistent with a manipulated dataset because the dataset wasn't manipulated for maternal comorbidites and so the racist signal in the data vanishes when looking at maternal mortality.
It would be a sign of data manipulation of the mother's outcomes depended on the race of her child's doctor.It should be noted that the mother’s physician (i.e., the obstetrician) is almost always different from the newborn’s physician (i.e., the pediatrician).
The difference in the comorbidity counts of race-concordant and race-discordant physicians in no way supports anything other than random chance. Not every difference is significant, and not every significant difference is meaningful.Either traditionally Black hospitals are the most racist but the racists are only racist against babies, and Florida has an unwritten policy of having the most difficult cases handled by doctors of ethnicity not matching the patient, or this dataset has been massaged a bit.
Al-O-Meter
Well-Known Member
Please tell me that as a father who has been through the process of child birth that you aren't gullible enough to fall for that piece of misdirection. The study is of newborns who die in childbirth. It isn't pediatricians we are talking about. If the mother died in childbirth or the infant died in childbirth, it would be the same doctor. It would be the obstetrician.It would be a sign of data manipulation of the mother's outcomes depended on the race of her child's doctor.
Last edited:
"Physician–patient racial concordance and disparities in birthing mortality for newborns"Please tell me that as a father who has been through the process of child birth that you aren't gullible enough to fall for that piece of misdirection. The study is of newborns who die in childbirth. It isn't pediatricians we are talking about. If the mother died in childbirth or the infant died in childbirth, it would be the same doctor. It would be the obstetrician.
The study is newborn deaths, not deaths during childbirth. Do you really believe there were over 1.8M babies in Florida who died during the birthing process over 1992-2015? The first pediatrician to see the child is the pediatrician on-call at the hospital, according to the study.
Al-O-Meter
Well-Known Member
No, because Florida doesn't have a 100% mortality rate for newborns. The 1.8M is the number of childbirths of Black and White infants who were included in the study after the researcher's tailoring of the dataset. The overwhelming majority did not die in childbirth or any other time. The overwhelming majority are still alive. Details don't seem to be your strong suit.Do you really believe there were over 1.8M babies in Florida who died during the birthing process over 1992-2015?
Looking at the numbers in Table 1 for the first column, the entry would be approximately 0.154 (that is, 0.154 + the standard of .290, so 50% higher) for black physicians treating white babies, and -.494 off the .604 for black babies. However, that column used no regression variables, and the numbers got smaller the more regression variables were added (as always happens).The same study showed white babies die more with black doctors. In both instances, the actual percentage was very small.
It really depends on which regression variables you fold in.I read this a few years ago and did not re-read now, so my recollection may be off, but the percentages were actually miniscule, not double as stated (based on my recollection at least).
A valid consideration.Premature or other NICU babies with a higher risk of death are more likely to be cared for my specialists, that happen to be more white. There are so many variables. No comparison by weight, early birth, disease, etc.
A fair point, but if the accommodations were significant to the practice of medicine, it is the school's fault for allowing them. Getting a four-function calculator or extra time on a test is one thing, allowing written notes as an accommodation is another.My friends ex had a learning disability and received all kinds of accomodations on exams in medical school. Good for her, but when it comes to my health, reading reports accurately, etc., I want the very best person treating me.
You got me there, I lost track of what the number represented.No, because Florida doesn't have a 100% mortality rate for newborns. The 1.8M is the number of childbirths of Black and White infants who were included in the study after the researcher's tailoring of the dataset. The overwhelming majority did not die in childbirth or any other time. The overwhelming majority are still alive. Details don't seem to be your strong suit.