Dr. Jha offers an optimistic take in this thread. If we vaccinate…
I came away with the same impression as Dr. Jha. The data shown in this presentation is far short of the scare mongering coming out of the media over the Delta variant. I even read an article yesterday on CNN at how the CDC is pissed at the media for blowing Delta variant into a bigger monster than it really is.
Here is the way I see this presentation:
Slide #1) Title
Slide #2) People are smart enough to recognize the contradicting messages. The exact same statistics used to scare people into masking can be used to imply the vaccines don’t work.
Slide #3) The vaccines work great! Go get vaccinated!
Slide #4) Data at first glance seems to show either waning protection from vaccines or increasing deadliness of newer variants, but makes clear in first bullet point that it only shows that more people are getting vaccinated so constants in protection and deadliness appear as a rising trend line. Slide #8 reinforces that vaccine protection isn’t waning.
Slide #5) Data collection protocols
Slide #6) Title
Slide #7) Baselines for non-Delta breakthrough cases.
Slide #8) No evidence of waning vaccine protection establishing any changes to metrics must be due to increased capability of variants.
Slide #9) Moderna and Pfizer vaccines are not quite as effective for immunocompromised people as they are for the general population but even for immunocompromised people they’re still extremely robust.
Slide #10) Protection from Moderna and Pfizer vaccines are again less effective for people of the age and health to be confined to nursing homes but even among those people the efficacy is 75%.
Slide #11) Example
Slide #12) Example with givens and result plot
Slide #13) Communication challenges
Slide #14) Title
Slide #15) Chart of transmissibly and deadliness. The most notable aspect is how much is not known as reflected by every other pathogen being a point while SARS-CoV-2 is represented by big boxes to represent possible ranges rather than definitive values.
Slide #16) Data from Indian study with AstraZeneca breakthrough I touched on in previous post.
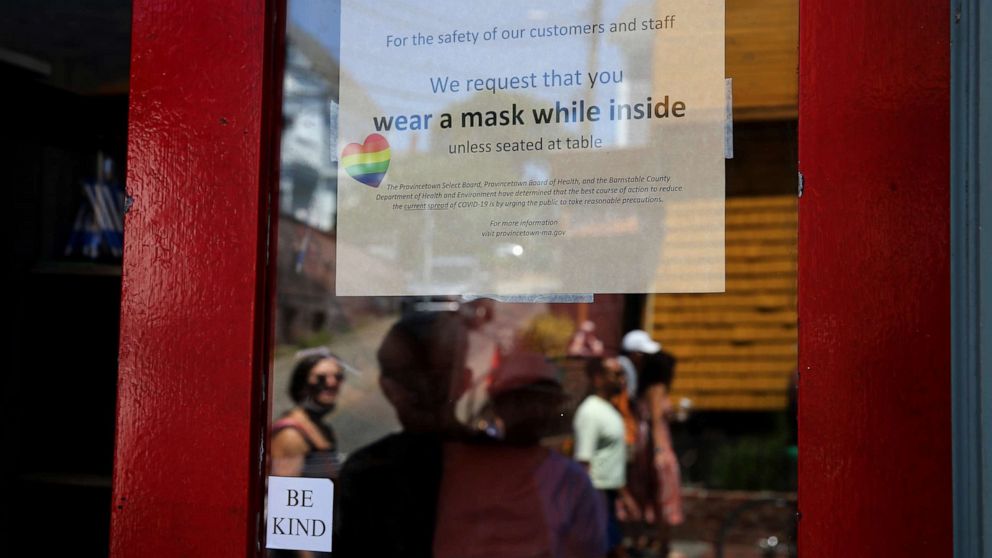
Slide #17) Delta variant has lower Ct value than Alpha. This refers to how many times a sample must be run through an amplifier to see genetic values. The takeaway is that lower Ct (less amplification needed) equals more virus in sample. They also briefly mention the Barnstable County outbreak but I’ll talk about that is another post because there is good info there and they don’t include it here.
Slide #18) FINALLY SOME MEANINGFUL DATA!!!! Delta variant could be deadlier than the original Wild Type. It isn’t a lot and the sample sizes are small but the difference is statistically significant.
Slide #19) The only chart in this entire presentation that needs to be there. You could delete every other slide except this one and lose almost nothing. The protection against all SARS-CoV-2 including against the Delta variant provided by Pfizer vaccine is EXTREMELY good at preventing hospitalization or death. The Delta variant does seem slightly more able to give Pfizer vaccinated people a case of the sniffles than the original could (even there Pfizer does pretty good) but the odds of it putting you in the hospital is extremely low.
Slides #20 & #21) The “you must wear a mask to save your life” charts. They are the same slide except one says “wear a mask or die” in bold red print. All givens used to generate these charts are hypothetical and they don’t seem close to real world values because what we’re seeing in the UK would be impossible if that weren’t the case.
The above chart is for newly detected infections in the UK where close to 100% of all new cases were Delta variant. The UK got rid of their mask mandates and all night club restrictions on July 19. The 7-day average case rate was 46,000 per day. They ended masking and the 7-day average rate has fallen nearly in half to 28,463. In the UK, the highly virulent Delta variant is burning itself out without masks.